Examples
Filling a Histogram
import bootstraphistogram

if __name__ == "__main__":
    # create histogram
    hist = bootstraphistogram.BootstrapHistogram(
        bootstraphistogram.axis.Regular(5, 0.0, 5.0), numsamples=10
    )
    # fill with data
    data = [1.0, 2.0, 2.0, 4.0]
    hist.fill(data)

    # get the "normal" histogram contents
    print(
        list(hist.nominal.axes.edges[0])
    )  # prints the bin edges: [0.0, 1.0, 2.0, 3.0, 4.0, 5.0]
    print(list(hist.nominal.view()))  # prints the bin contents: [0. 1. 2. 0. 1.]

    # get the bootstrap samples
    print(list(hist.samples.view()[1]))  # prints 10 samples for bin 1
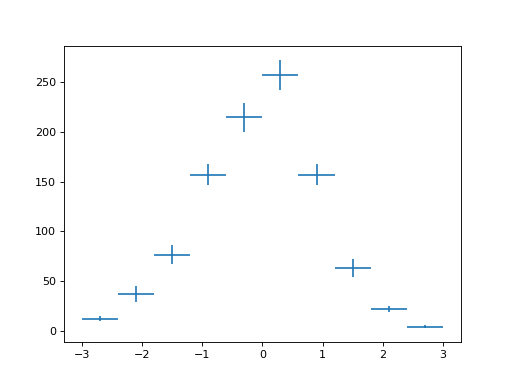
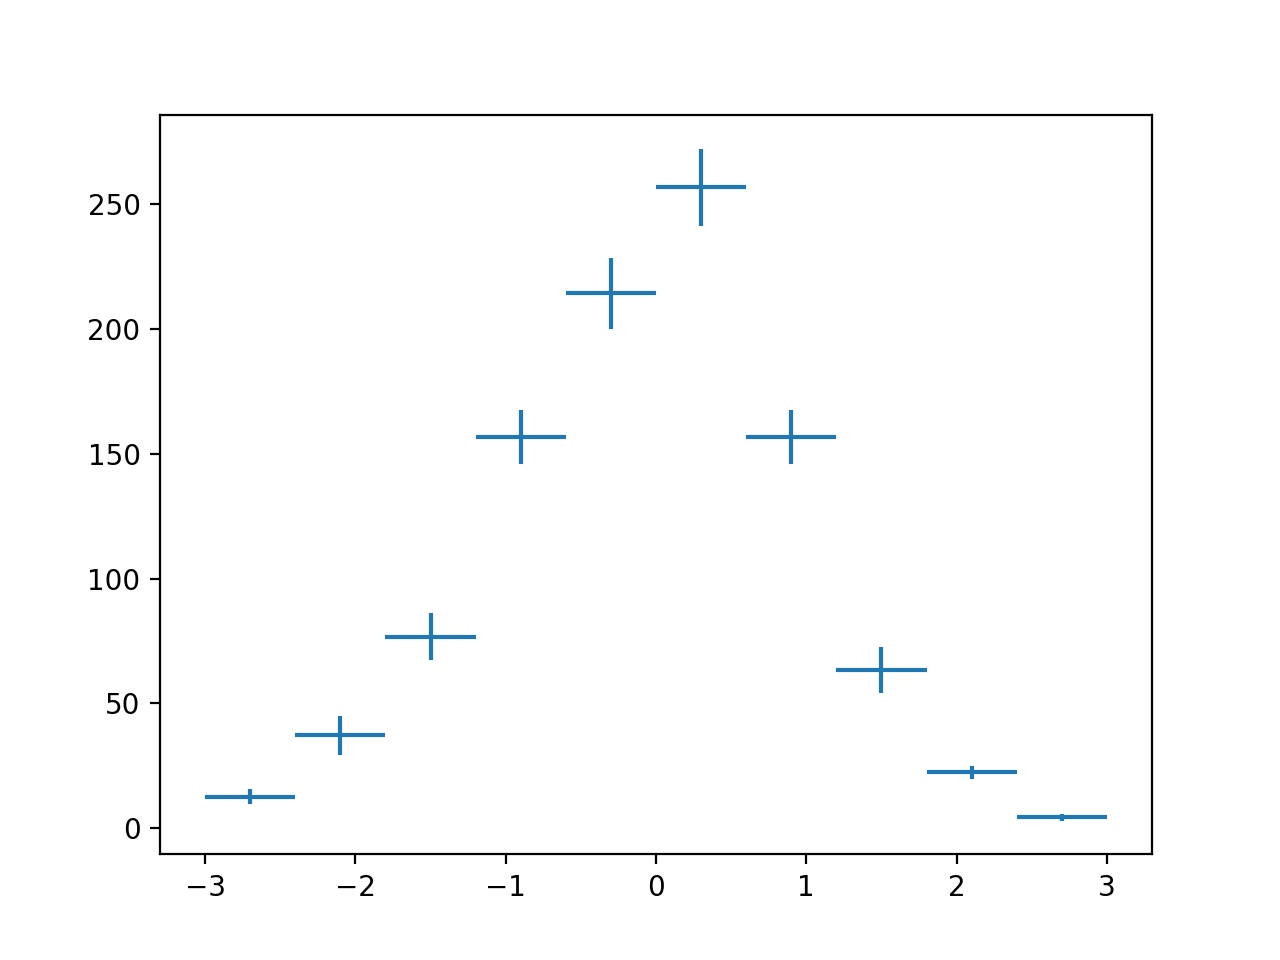
Error Bar Plot
import matplotlib.pyplot as plt
import numpy as np

import bootstraphistogram

# create histogram
hist = bootstraphistogram.BootstrapHistogram(
    bootstraphistogram.axis.Regular(10, -3.0, 3.0), numsamples=10
)

# fill with some random normal data
data = np.random.normal(size=1000)
hist.fill(data)

# plot the samples
bootstraphistogram.plot.errorbar(hist, ls="")
plt.show()
(Source code, png, hires.png, pdf)

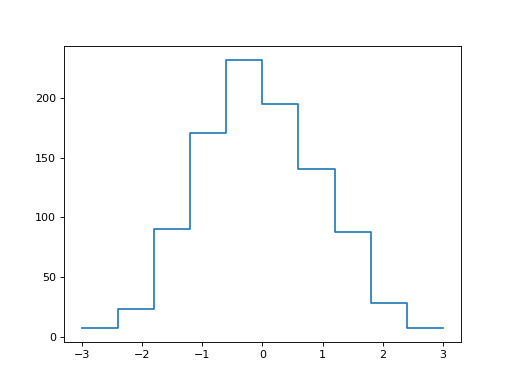
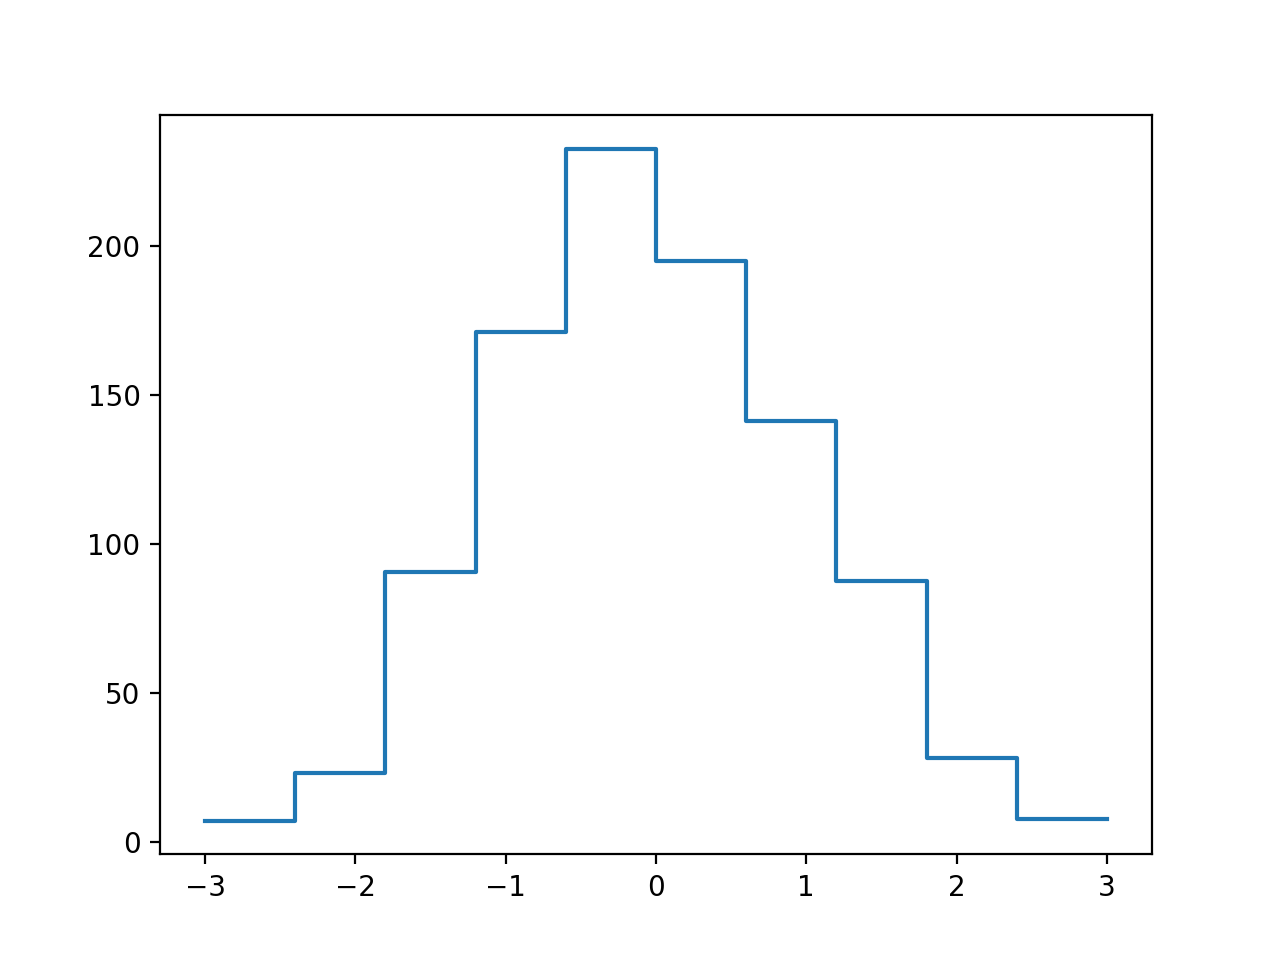
Step Plot
import matplotlib.pyplot as plt
import numpy as np

import bootstraphistogram

# create histogram
hist = bootstraphistogram.BootstrapHistogram(
    bootstraphistogram.axis.Regular(10, -3.0, 3.0), numsamples=10
)

# fill with some random normal data
data = np.random.normal(size=1000)
hist.fill(data)

# plot the median sample
bootstraphistogram.plot.step(hist, percentile=50.0)
plt.show()
(Source code, png, hires.png, pdf)

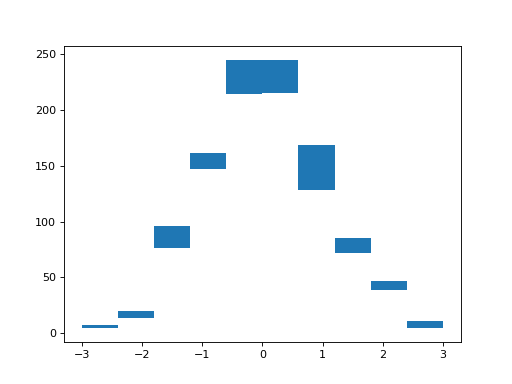
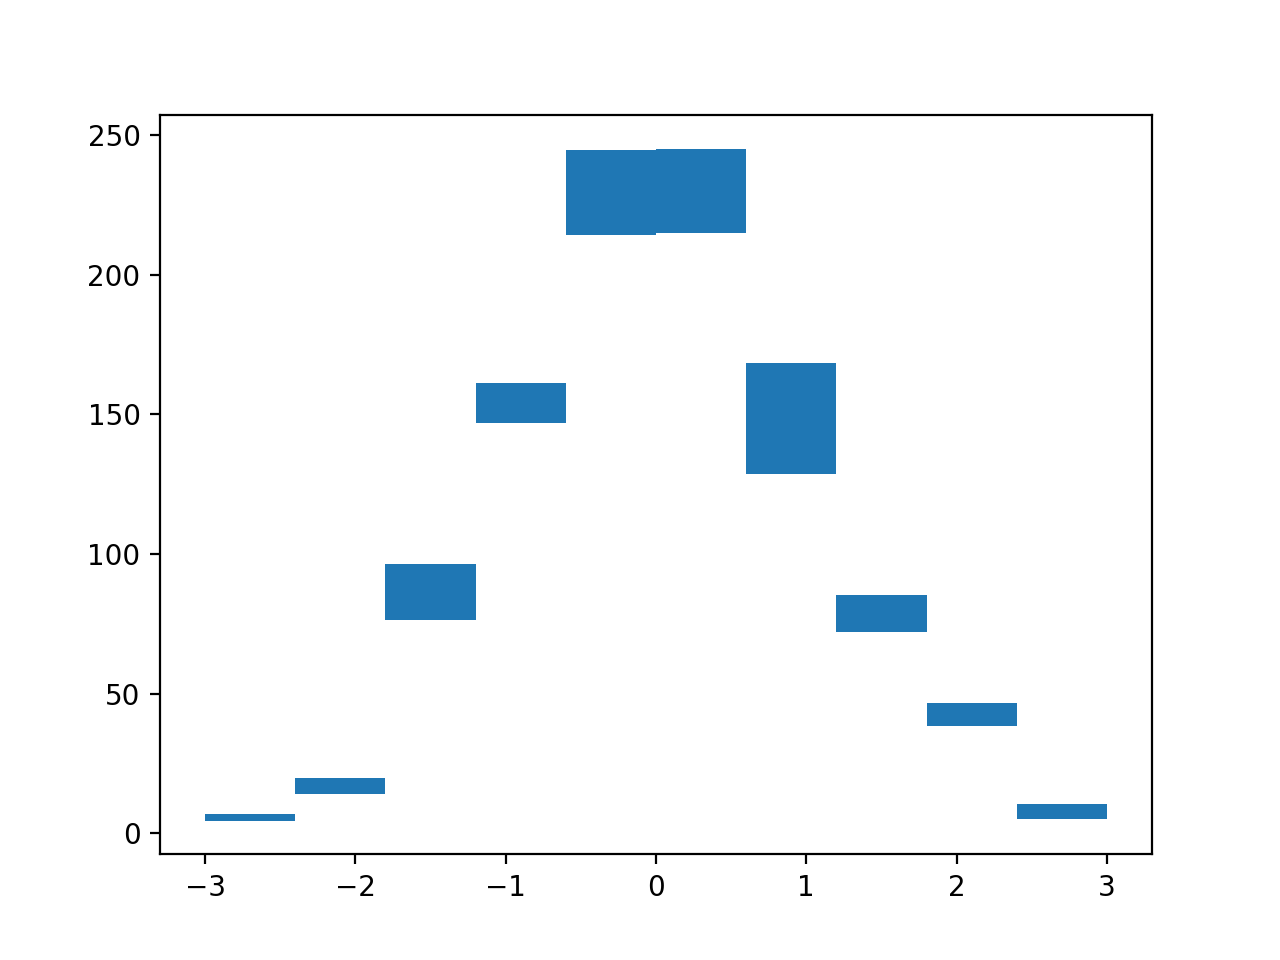
Fill Plot
import matplotlib.pyplot as plt
import numpy as np

import bootstraphistogram

# create histogram
hist = bootstraphistogram.BootstrapHistogram(
    bootstraphistogram.axis.Regular(10, -3.0, 3.0), numsamples=10
)

# fill with some random normal data
data = np.random.normal(size=1000)
hist.fill(data)

# plot the samples
bootstraphistogram.plot.fill_between(hist)
plt.show()
(Source code, png, hires.png, pdf)

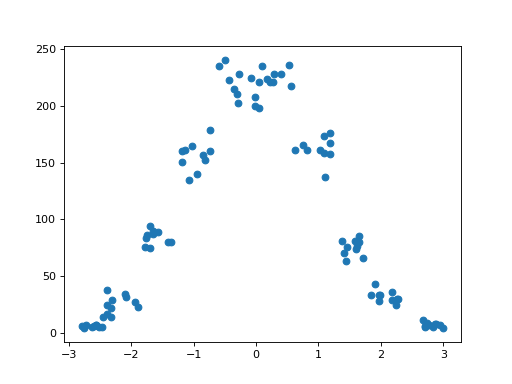
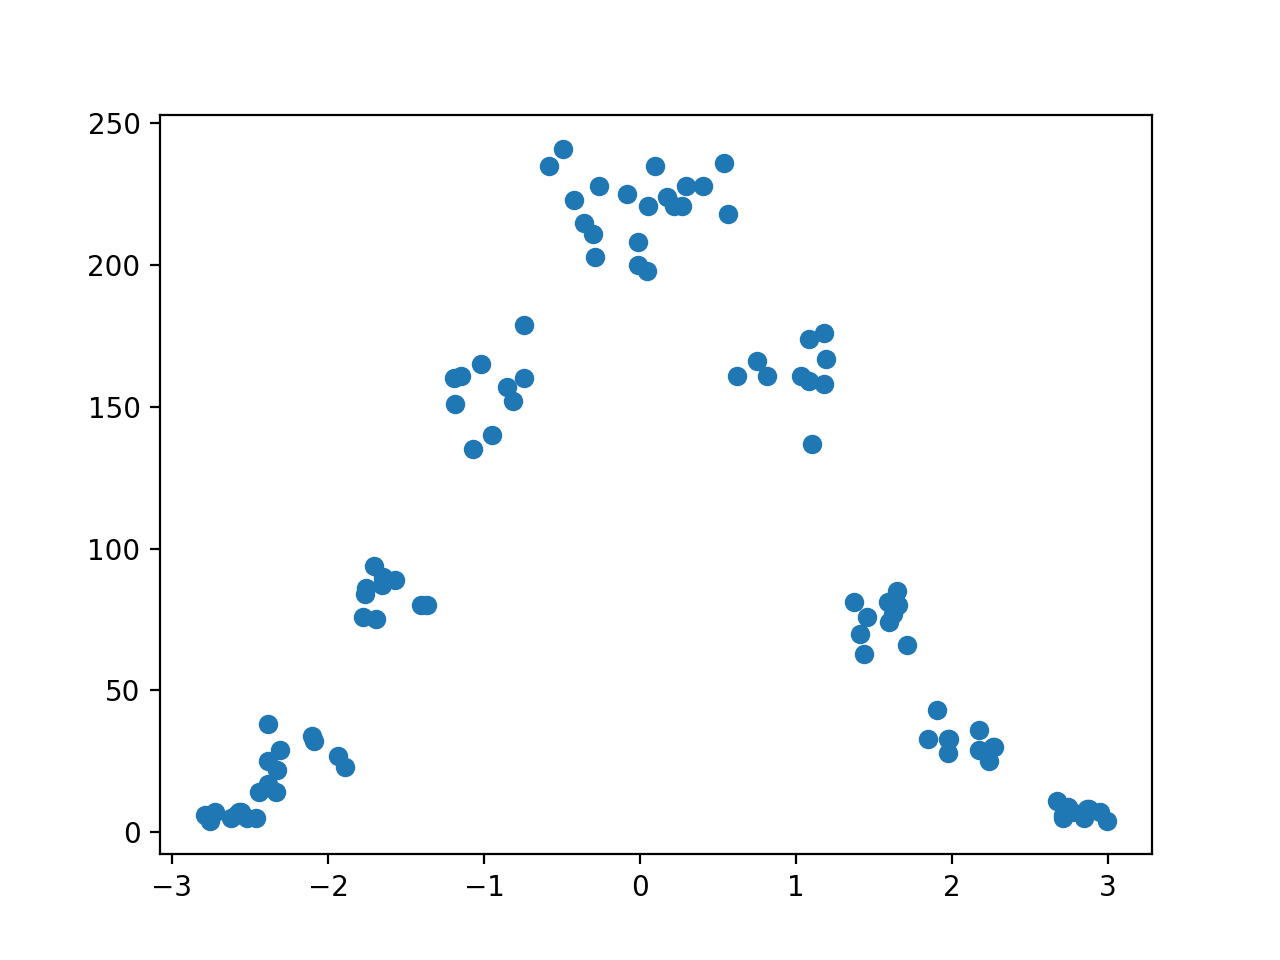
Scatter Plot
import matplotlib.pyplot as plt
import numpy as np

import bootstraphistogram

# create histogram
hist = bootstraphistogram.BootstrapHistogram(
    bootstraphistogram.axis.Regular(10, -3.0, 3.0), numsamples=10
)

# fill with some random normal data
data = np.random.normal(size=1000)
hist.fill(data)

# plot the samples
bootstraphistogram.plot.scatter(hist)
plt.show()
(Source code, png, hires.png, pdf)

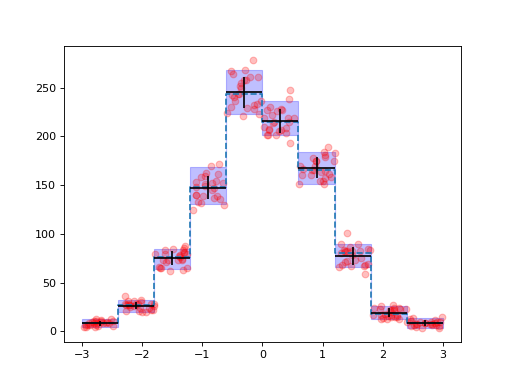
A More Complex Plot
import matplotlib.pyplot as plt
import numpy as np

import bootstraphistogram

# create histogram
hist = bootstraphistogram.BootstrapHistogram(
    bootstraphistogram.axis.Regular(10, -3.0, 3.0), numsamples=25
)

# fill with some random normal data
data = np.random.normal(size=1000)
hist.fill(data)

# plot the samples
bootstraphistogram.plot.fill_between(
    hist, percentiles=(5.0, 95.0), color="blue", alpha=0.25
)
bootstraphistogram.plot.step(hist, percentile=50.0, ls="--")
bootstraphistogram.plot.scatter(hist, color="red", alpha=0.25)
bootstraphistogram.plot.errorbar(hist, color="black", ls="")
plt.show()
(Source code, png, hires.png, pdf)

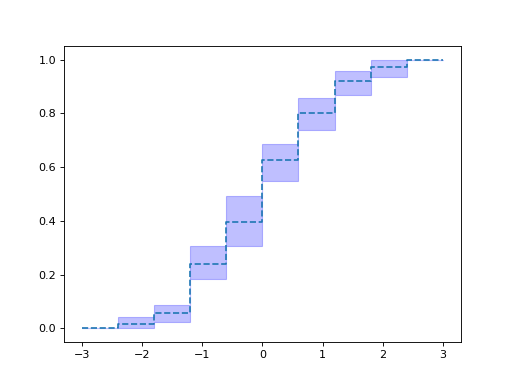
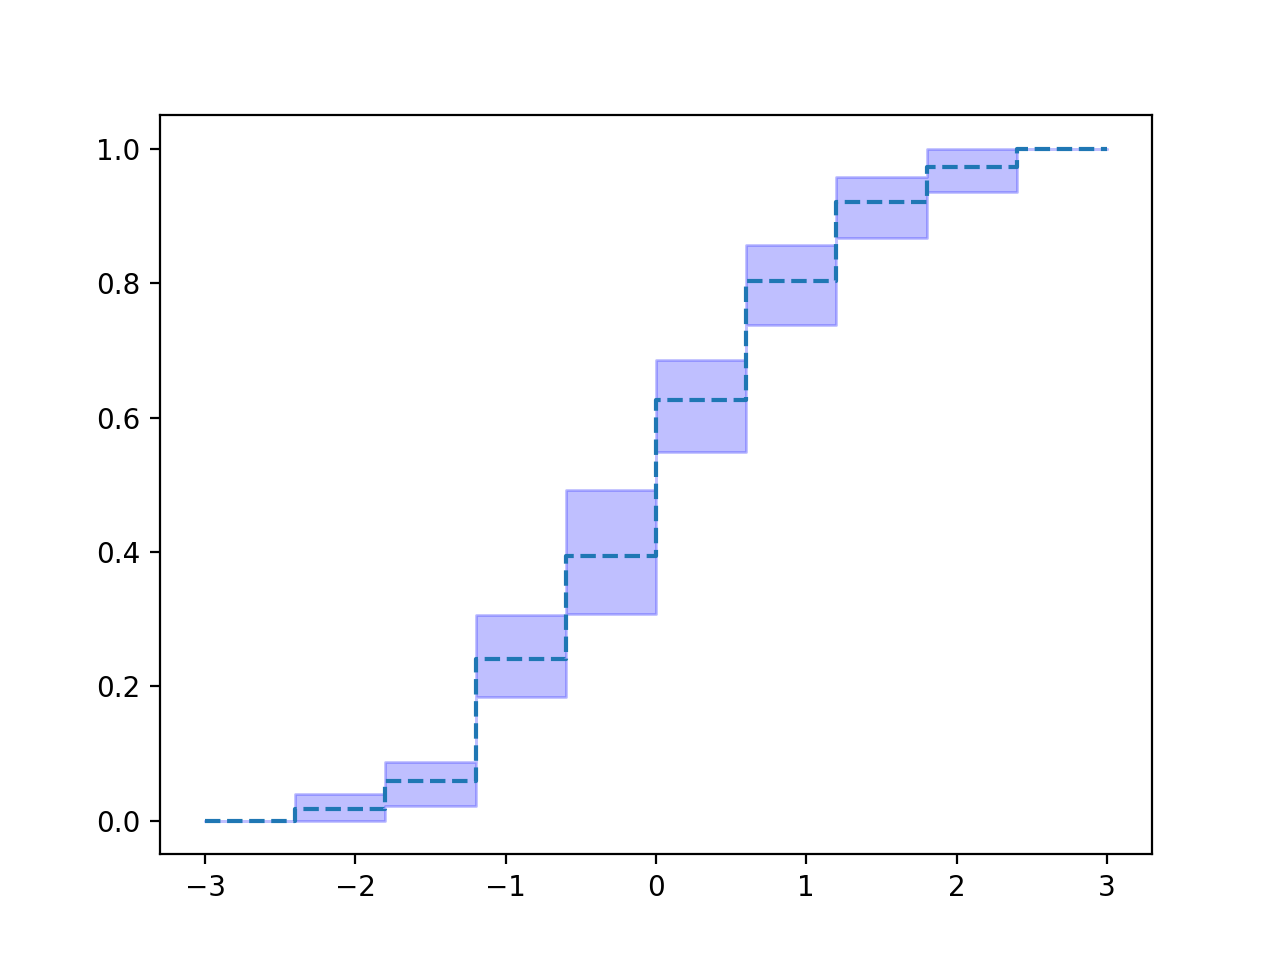
Efficiency plot
import matplotlib.pyplot as plt
import numpy as np

import bootstraphistogram

# create histogram
hist = bootstraphistogram.BootstrapEfficiency(
    bootstraphistogram.axis.Regular(10, -3.0, 3.0), numsamples=100
)

# fill with some random normal data
xvalues = np.random.uniform(-3.0, 3.0, size=1000)
selected = np.random.normal(size=1000) < xvalues
hist.fill(selected, xvalues)

# plot the efficiency curve
bootstraphistogram.plot.fill_between(
    hist.efficiency, percentiles=(5.0, 95.0), color="blue", alpha=0.25
)
bootstraphistogram.plot.step(hist.efficiency, percentile=50.0, ls="--")
plt.show()
(Source code, png, hires.png, pdf)